
In 2026, acquiring new clients in financial services has become more expensive than ever. Stricter AML/KYC requirements, evolving regulatory frameworks, and rising digital advertising costs mean that simply driving more website visitors to your pages no longer guarantees growth. The institutions that thrive are those that master conversion rate optimization, the systematic process of turning existing traffic into identified, compliant clients.
Conversion rate optimization important: For regulated financial services, CRO is essential because it enables measurable improvements in converting visitors into clients while ensuring compliance, maximizing the value of every marketing dollar spent, and supporting sustainable growth in a highly competitive environment.
For banks, wealth managers, insurers, and other regulated institutions, conversion rate optimization (CRO) is not about copying e-commerce tactics. It is about designing digital journeys that respect regulatory requirements while removing friction from critical actions such as opening an account, booking a meeting, submitting a KYC form, or requesting a portfolio review. InvestGlass, the Swiss-hosted CRM and automation platform, has been built specifically for this purpose, embedding conversion rate optimization tools and cro tools across onboarding, client portals, and marketing automation to help financial institutions optimize every step of the client journey.
Consider this concrete example from early 2026: a European private bank struggled with a 32% completion rate on its MiFID II-compliant suitability questionnaire. After deploying InvestGlass form analytics to identify drop-off points and testing simplified wording while maintaining full regulatory compliance, the completion rate rose to 48%. That single improvement generated dozens of additional qualified prospects per month without increasing media spend. Website performance, such as form load times and usability, also played a key role in improving conversion rates.
The difference between traffic-focused and conversion-focused strategies is stark: while traffic-focused strategies aim to increase visitors, conversion-focused strategies are designed to turn those visitors into paying customers, directly impacting revenue and business growth.
Strategy Type | Primary Goal | Key Metric | InvestGlass Role |
|---|---|---|---|
Traffic-Focused | Drive more visitors | Impressions, clicks | Marketing automation for lead generation |
Conversion-Focused | Convert existing visitors | Completion rate, cost per conversion | Onboarding workflows, A/B testing, form analytics |
When identifying drop-off points and improving forms, combining data from analytics and user feedback is crucial to pinpoint friction points in the conversion funnel and optimize the user experience.
This conversion rate optimization guide will walk you through the principles, processes, and practical strategies that regulated institutions need to boost conversions in 2026 and beyond.
What Is Conversion Rate & Conversion Rate Optimization?
In financial services, a conversion represents a completed action that moves a prospect or client forward in their relationship with your institution. Unlike e-commerce where conversions typically mean purchases, financial conversions span a wider range of high-value actions.
- Account opening: A prospect completes digital onboarding and becomes a client
- KYC completion: A client submits all required identity and tax documentation inside InvestGlass
- Portfolio upload: A prospect transfers existing holdings for analysis
- Digital signature: A client e-signs a discretionary mandate or advisory agreement
- Meeting booked: A prospect schedules a consultation with a relationship manager
- Document e-signed: A client accepts terms, investment proposals, or regulatory disclosures
- Web form submission: A prospect or client submits a web form, such as a contact request or information inquiry
The formula to calculate conversion rate is straightforward:
Conversion Rate = (Number of Conversions ÷ Number of Qualified Visitors) × 100
For example, if 500 prospects visited your digital onboarding landing page in Q1 2026 and 75 completed the full KYC process, your conversion rate would be 15% (75 ÷ 500 × 100).
To measure and analyze conversion rates, financial institutions rely on conversion rate optimization tools and platforms like Google Analytics to track visitor behavior, monitor conversion actions, and identify opportunities for improvement. The conversion rate optimization process is a structured approach to testing UX, messaging, workflows, and compliance steps to increase that percentage. InvestGlass enables institutions to run this process across the entire client lifecycle, from the first landing page visit to in-portal upsell offers, with all data hosted in Switzerland or on-premise for complete data sovereignty.
Macro vs. Micro Conversions in Wealth & Banking Journeys
Not all conversions carry equal weight. Understanding the distinction between macro and micro conversions helps institutions identify optimization opportunities at every stage of the user journey. Optimizing each step requires a clear understanding of user intent, ensuring that content and design align with what visitors are seeking at each touchpoint.
Macro conversions represent the primary business objectives that directly impact revenue and AUM. These include a client signing a discretionary mandate, opening a private banking account, or completing a substantial fund subscription. Micro conversions are the smaller steps that indicate engagement and predict future macro conversions.
Concrete micro conversions that InvestGlass tracks include:
- Clicking the “Request call back” button on a product page
- Viewing detailed information on product pages
- Saving a draft onboarding form without completing it
- Consenting to data processing during initial registration
- Activating two-factor authentication in the client portal
- Downloading a PRIIP KID or fund factsheet
- Starting the onboarding form but not finishing
- Uploading an ID document as the first verification step
The compounding effect of micro conversion improvements is substantial. A 10% uplift in “start onboarding” clicks in January 2026 can translate to measurably higher macro conversion rates by Q2, as more prospects enter and progress through the funnel. InvestGlass dashboards let relationship managers and compliance teams monitor both macro and micro conversion funnels by segment, product type, and jurisdiction, enabling data-driven prioritization of optimization efforts.
Why Conversion Rate Optimization Matters for Regulated Institutions
In 2026, the economics of client acquisition have shifted dramatically. Compliance costs have risen, digital advertising has become more competitive, and prospects expect seamless digital experiences that match what they encounter in consumer applications. These factors make conversion rate optimization (CRO) more cost-effective than simply buying more web traffic. Implementing a structured CRO program with a clear roadmap, defined goals, and integrated tools ensures long-term success by continuously improving conversion rates across all digital touchpoints.
Consider the math: if your institution attracts 20,000 qualified prospects to its digital onboarding pages annually and converts 5% (1,000 new clients), increasing conversion to 7% yields 1,400 new clients. That is 400 additional clients without increasing your media spend by a single franc or euro. When applied to high-touch segments like HNW and UHNW prospects, the revenue impact multiplies significantly, especially when each stage of the sales process is optimized to reduce friction and encourage actions such as demo sign-ups or booking meetings with sales reps.
Key business benefits of CRO for regulated institutions:
- Lower customer acquisition costs per client without requiring larger marketing budgets
- Improved UX that meets modern client expectations while remaining compliant with FINMA, ESMA, and local regulators
- Better data quality from more complete digital journeys feeding InvestGlass AI for improved recommendations
- Competitive differentiation against institutions still relying on paper-based or fragmented digital processes
- Scalability across markets and client segments using InvestGlass approval workflows and localized content
Impact on Cost, Compliance, and Client Lifetime Value
The benefits of conversion optimization extend far beyond marketing efficiency. When institutions improve conversion on digital onboarding inside InvestGlass, they reduce manual back-and-forth with compliance teams by 15-25% over a 12-month period.
- Every completed KYC and suitability review increases potential AUM and lifetime value, especially when data flows seamlessly into InvestGlass portfolio management for ongoing relationship development
- A Swiss wealth manager using InvestGlass from 2023 to 2025 improved suitability questionnaire completion from 54% to 73%, contributing to double-digit percentage increases in annual net new AUM
- Higher-quality data from more complete digital journeys feeds InvestGlass AI, improving product recommendations and cross-sell conversion rates
- Reduced compliance remediation costs when client data is captured correctly the first time
- Faster time-to-revenue as clients move from prospect to fully onboarded status in days rather than weeks
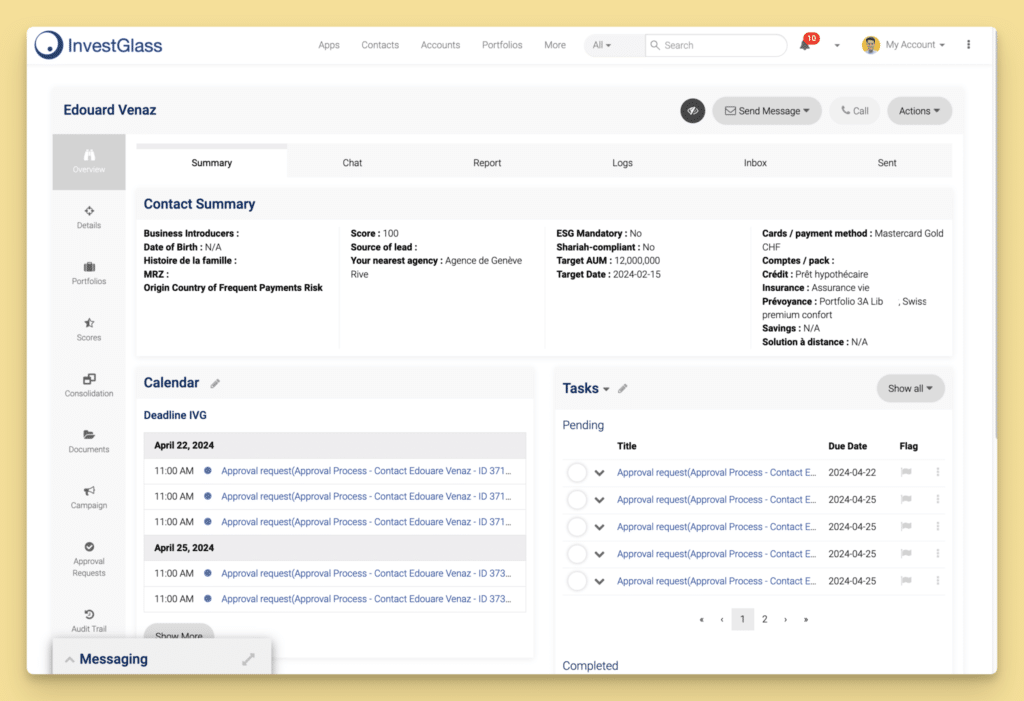
Core CRO Elements on Financial & Wealth Management Sites
Effective conversion rate optimization efforts focus on specific page types and touchpoints where friction most commonly occurs. Website performance such as fast load times and smooth navigation is essential at these touchpoints, as it reduces friction, improves user experience, and directly impacts conversion rates.
For financial institutions using InvestGlass, the following areas represent the highest-impact optimization opportunities:
- Homepage and value proposition: The first impression that determines whether prospects explore further
- Product and portfolio pages: Where prospects evaluate specific offerings and services
- Pricing and fee explanations: Critical for transparency and regulatory compliance
- Digital onboarding and KYC flows: The primary conversion bottleneck for most institutions
- Client portals and secure messaging: Where existing client upsell and engagement conversions happen
All examples in this section assume InvestGlass as the underlying CRM, workflow, and portal layer, hosted in Switzerland or on-premise for complete data sovereignty.
Homepage & Value Proposition
The homepage of a financial institution serves a different purpose than an e-commerce site. Prospects arriving from organic traffic, paid campaigns, or referrals need to understand immediately whether your institution serves their needs and in which jurisdictions you operate.
A high-converting homepage for regulated institutions should present a clear value proposition in the first screen. This includes the type of clients you serve (retail, HNW, institutional), the jurisdictions covered, and the core services offered such as discretionary mandates, ESG portfolios, or corporate finance advisory.
InvestGlass enables A/B testing to compare different homepage approaches. For example, testing a compliance-heavy homepage emphasizing regulatory credentials against a client-outcome-focused homepage measuring clicks on “Start digital onboarding” can reveal which message resonates with your target audience. Optimizing your homepage not only increases conversions but can also improve your search engine ranking, driving more qualified traffic to key conversion pages.
Key elements to include in homepage design:
- Clean hero section with one main call to action such as “Open an account with digital onboarding powered by InvestGlass”
- Swiss data sovereignty and InvestGlass hosting as a trust signal for privacy-conscious clients, see our guide to the digital banks in Switzerland
- Clear navigation to key conversion pages (onboarding, contact, product information)
- Social proof elements such as client count, AUM managed, or years of operation
- Regulatory credentials (FINMA license, ESMA compliance) displayed prominently
- Mobile-responsive design with fast loading times to prevent users drop off
Pricing, Fees & Disclosure Pages
Transparent fee structures and regulatory disclosures are not just compliance requirements in Europe and Switzerland. They are conversion optimization strategies. Prospects who understand pricing quickly are more likely to proceed to the next step.
The challenge is presenting complex fee information (retrocessions, MiFID II costs, performance fees) in a way that does not overwhelm prospects. InvestGlass can prefill fee illustrations and PRIIPs data dynamically, reducing friction and helping prospects understand pricing in under 60 seconds.
Concrete example: A bank in 2024 used InvestGlass to test a “fee simulator” widget that allowed prospects to estimate costs based on their investment amount versus static PDF fee schedules. The interactive approach increased “request meeting” conversions by 18% among qualified visitors.
Elements to include on pricing pages:
- Brief introductory text explaining the institution’s fee philosophy
- Simple comparison of service tiers with clear differentiation
- Interactive fee calculator powered by InvestGlass data
- Clear CTA to schedule a meeting or launch onboarding inside InvestGlass
- Trust badges including FINMA license statements and Swiss hosting
- FAQ section addressing common pricing questions
- Links to required regulatory disclosures (without making them the primary focus)
Digital Onboarding & KYC Flows
Digital onboarding forms represent the single most important CRO lever for regulated institutions using InvestGlass. This is where prospects transition from interested visitors to identified, compliant clients, and where conversion rate optimization techniques deliver the highest ROI.
Best practices for high-converting onboarding flows:
- Split long forms into logical steps: identity verification, tax residency, investment profile, and risk assessment
- Show progress bars so prospects understand how far they have come and how much remains
- Enable auto-save of drafts via InvestGlass so prospects can return without starting over
- Support mobile capture of passports and IDs using smartphone cameras
- Provide clear explanations for why each piece of information is required (regulatory context)
- Minimize optional marketing fields in the initial steps
- Display security badges and encryption indicators throughout
A 2025 case study illustrates the impact: transforming a 7-page PDF onboarding pack into an InvestGlass digital journey cut abandonment from 41% to 22% for a private bank. The conversion process became shorter, clearer, and fully compliant.
InvestGlass enables measurement at each step: start rate, drop-off by step, completion rate, document upload success, and e-signature rate. This granular conversion tracking reveals exactly where users drop off and informs hypothesis development for further optimization.
Client Portals & Secure Messaging
Conversion does not stop at acquisition. In wealth management, some of the highest-value conversions happen inside the InvestGlass client portal, where existing clients decide whether to expand their relationship.
Examples of in-portal conversions to track and optimize:
- “Book portfolio review” requests from existing clients
- “Accept new investment proposal” actions on advisor recommendations
- “Upgrade to discretionary management” from advisory mandates
- “Subscribe to ESG newsletter” or thematic content
- “Approve rebalancing” on portfolio adjustment proposals
- “Refer a contact” through client referral programs
InvestGlass uses in-portal banners and personalized messages to nudge clients toward actions based on portfolio gaps, risk changes, or market opportunities. Tracking portal conversion rates over time reveals trends, for example, comparing the percentage of clients accepting proposed rebalancing within 7 days in 2026 versus 2025 shows whether user engagement is improving.
The Conversion Rate Optimization Process with InvestGlass
CRO is not a one-time project. It is a repeatable loop of research, hypothesis development, prioritization, testing, learning, and scaling. The institutions that achieve continuous optimization embed this loop into their operational rhythm.
InvestGlass CRM unifies CRM, client portal, and automation, enabling CRO experiments to span the entire client lifecycle rather than being limited to the marketing site. A hypothesis about onboarding can be tested and validated using the same platform that manages client relationships, with all user behavior data and results stored in Swiss-hosted infrastructure aligned with banking secrecy and GDPR/FINMA requirements.
The CRO funnel in InvestGlass follows this flow:
- Research: Gather quantitative data and qualitative data to identify friction points. Combining data from analytics and user feedback provides a comprehensive understanding of user behavior and helps pinpoint optimization opportunities.
- Hypothesis: Formulate testable predictions about what changes will improve conversions
- Prioritization: Rank hypotheses by impact, importance, and ease of implementation
- Testing: Run split testing or multivariate testing with statistical rigor
- Learning: Analyze results and document findings for audit and future reference
- Scaling: Deploy winning variants across markets and segments
Research: Quantitative & Qualitative Data in Regulated Contexts
Effective CRO begins with understanding where users drop off and why. InvestGlass website analytics identify quantitative patterns across onboarding steps, KYC refresh reminders, suitability questionnaires, and document uploads.
Research activities inside InvestGlass:
- Analyze conversion rates by traffic source, geography, and device type using behavior analytics
- Review funnel reports to identify which steps have the highest abandonment
- Examine time-on-step data to find where prospects hesitate
- Segment analysis by client type (retail vs. HNW) and product interest
- Combine web analytics with qualitative feedback from relationship managers who speak directly with prospects
- Survey clients who completed onboarding about their experience
- Interview relationship managers about common objections and pain points
Concrete example: A private bank discovered in March 2025 that 60% of prospects abandoned the “tax residency” screen. User research and feedback from advisors revealed that the CRS/FATCA language was confusing. Simplifying the wording while maintaining full compliance reduced abandonment to 38%.
Data minimization and privacy-by-design remain essential. Only track what is necessary for optimization and conversion goals, and log all events inside InvestGlass for audit purposes.
Hypothesis & Prioritization for Financial Journeys
With research insights in hand, the next step is formulating testable hypotheses specific to financial workflows. A well-structured hypothesis includes the change, the expected outcome, and the metric that will prove or disprove it.
Example hypotheses for financial institutions:
- “If we allow ID upload via smartphone inside the InvestGlass onboarding, completion will increase by 10% in Q3 2026”
- “If we add a progress bar to the suitability questionnaire, drop-off at step 3 will decrease by 15%”
- “If we display estimated time to complete (4 minutes) on the onboarding start page, start rate will increase by 8%”
- “If we send an automated reminder email 24 hours after a prospect abandons onboarding, 20% will return to complete”
Prioritization should focus tests on high-value flows: private banking leads, corporate lending requests, or high-AUM prospects flagged in InvestGlass CRM. A simple scoring model evaluates each hypothesis on impact (how much will conversion improve), importance (how critical is this flow to business objectives), and ease (how quickly can we implement and test).
Prioritization example:
Hypothesis | Impact | Importance | Ease | Priority Score |
|---|---|---|---|---|
Smartphone ID upload | High | High | Medium | 8/10 |
Progress bar on questionnaire | Medium | High | High | 7/10 |
Reminder email for abandoners | Medium | Medium | High | 6/10 |
Testing: A/B and Multivariate Experiments with InvestGlass
InvestGlass can integrate with or embed A/B testing logic on onboarding steps, landing pages, and portal banners. The platform supports both simple A/B tests (one variable changed) and more complex multivariate testing (multiple elements tested simultaneously).
Testing examples in financial contexts:
- Shorter versus longer risk-profile explanations on the suitability questionnaire
- One-step versus two-step meeting booking process
- Single CTA versus dual CTA in the client portal
- Text-only trust signals versus badge-format trust signals on onboarding pages
- Different ordering of form fields (personal info first versus investment profile first)
Statistical validity is essential. A concrete scenario: running an 8-week test on 5,000 unique website visitors to a Swiss retail banking landing page in early 2026 provides sufficient sample size for 95% confidence in results. The average conversion rate serves as the baseline against which variants are measured.
Regulatory constraints must guide test design. Tests must not mislead clients and must maintain identical risk disclosures across variants. InvestGlass approval workflows ensure that compliance teams review and approve all test variants before deployment.
Learning, Documentation & Scaling Winning Variants
InvestGlass allows teams to attach notes and documentation to each campaign or workflow change, creating an audit trail for future reference and regulatory examination.
Documentation example: A bank logs that variant B (simplified ESG explainer) increased sustainable-product adoption by 23% among clients under 45 in 2025. The documentation includes the hypothesis, test duration, sample size, statistical confidence, and compliance approval.
Key considerations for scaling:
- Wins should be scaled across markets only when local regulation allows
- EU, Swiss, and Middle East regulatory environments differ significantly in 2026
- InvestGlass automation can roll out winning variants to appropriate segments automatically
- Relationship managers should be notified of new best practices and talking points
- Ongoing monitoring ensures that wins persist over time and do not degrade
Key CRO Strategies for Banks, Wealth Managers & Insurers
The following CRO strategies adapt proven digital marketing tactics into compliance-aware implementations for regulated financial services. Each strategy is implemented via InvestGlass workflows with appropriate governance and audit trails. CRO tools are used to implement, test, and measure the effectiveness of these strategies, enabling data-driven optimization and improved conversion rates.
- Personalization with InvestGlass AI
- Marketing automation and nurture sequences
- Social proof and trust signals for regulated brands (including user generated content, which serves as powerful social proof to build trust and boost conversions)
- Mobile-first experiences
Personalization with InvestGlass AI
InvestGlass AI segments clients by AUM, risk profile, geography, product usage, and engagement patterns to serve different CTAs and content. Personalization in financial services goes beyond using a client’s name; it involves presenting relevant opportunities based on portfolio context.
Personalization examples:
- Showing a “Schedule a 30-minute portfolio review” CTA to clients whose cash allocation exceeds 25% for more than 90 days
- Displaying ESG investment opportunities to clients who have indicated sustainable investing preferences
- Presenting currency hedging options to clients with significant foreign currency exposure
- Recommending educational content based on the client’s investment experience level
A European wealth manager using InvestGlass personalization achieved 15% higher meeting-booking conversion among clients receiving personalized CTAs compared to generic messaging.
Compliance considerations remain paramount. Personalization in 2026 must respect GDPR, FADP (Swiss data protection), and internal policies. All data stays in Swiss data centers or on-premise instances of InvestGlass, ensuring complete data sovereignty.
Marketing Automation & Nurture Sequences
InvestGlass marketing automation sequences convert visitors into qualified investors through education rather than aggressive sales tactics. The goal is to move prospects through a series of micro conversions that build trust and demonstrate value.
Example nurture journey:
- Prospect downloads a “2026 Swiss Wealth Management Outlook” report from your own website
- Automated email sequence delivers related educational content over two weeks
- Prospect completes a KYC-lite form to access premium content
- Behavior triggers invitation to full digital onboarding
- High-intent prospects are routed directly to relationship managers with all leads generated data attached
InvestGlass scoring rules identify high-intent leads based on engagement patterns. A prospect who opens multiple emails, downloads several reports, and starts the suitability questionnaire receives a higher score than one who only downloaded a single document. Relationship managers receive alerts when prospects cross engagement thresholds, enabling timely outreach.
Social Proof & Trust Signals for Regulated Brands
Social proof in financial services differs from consumer products. Client testimonials require careful handling due to confidentiality obligations and advertising regulations. However, appropriate trust signals significantly increase conversions.
Types of social proof appropriate for regulated institutions:
- Anonymized case studies describing client outcomes without identifying details
- Client satisfaction metrics from verified surveys
- Audited performance ranges where regulatory frameworks permit
- Industry awards and recognitions
- Media mentions and analyst coverage
- Regulatory credentials and memberships
InvestGlass can host and surface appropriate testimonials in client portals while respecting confidentiality and local advertising rules. Display security badges should appear next to high-intent CTAs (open account, upload documents, e-sign) to reinforce trust at critical decision points.
Concrete example: Adding Swiss hosting and FINMA-oversight badges to an onboarding landing page increased completed applications by 12% in 2024. Trust signals are particularly effective for prospects from jurisdictions with concerns about data privacy and regulatory oversight.
Mobile-First Experiences
In 2026, more than half of retail banking and robo-advisory website traffic arrives on mobile devices. Institutions that neglect mobile optimization lose significant conversion potential.
Mobile design requirements for InvestGlass-powered journeys:
- Larger tap targets for CTAs and form fields
- Single-column form layouts that scroll naturally
- Biometric login options (Face ID, fingerprint) integrated with InvestGlass authentication
- Mobile document capture using smartphone cameras for ID verification
- Responsive tables and charts in client portals
- Fast loading times under 3 seconds on mobile networks
A mid-size Swiss retail bank saw mobile onboarding conversion rise from 18% to 31% after rebuilding journeys with InvestGlass mobile UX patterns. The improvements included camera-based document capture, simplified form fields, and touch-friendly navigation.
Testing across different devices and OS versions is essential. InvestGlass dashboards track mobile versus desktop conversion separately, enabling teams to identify device-specific friction points.

Measuring Success: CRO Metrics & Dashboards in InvestGlass
Effective CRO requires continuous measurement against defined conversion metrics. InvestGlass provides dashboards that track the key metrics financial institutions need to monitor optimization progress. In addition to native analytics, teams can leverage conversion rate optimization tools, CRO tools, and Google Analytics to monitor and analyze website performance and conversion metrics, ensuring a comprehensive view of user behavior and site effectiveness.
Essential metrics to track:
- Overall conversion rate: Percentage of qualified visitors completing target actions
- Step-by-step funnel completion: Conversion rate at each stage of onboarding or application processes
- Cost per conversion: Marketing spend divided by number of completed conversions
- Net new AUM per converted client: Average assets brought by each new client
- Time to onboard: Days from first contact to fully compliant client status
- Average order value equivalent: Initial investment or mandate size
Comparative analysis reveals trends. For example, comparing Q1 2025 versus Q1 2026 onboarding completion rates shows whether optimization efforts are delivering results. InvestGlass lets teams slice data by advisor, branch, segment, product, and jurisdiction for granular user behavior insights.
Dashboard walkthrough example: A head of digital transformation at a regional bank reviews the InvestGlass CRO dashboard weekly. The dashboard displays overall site’s conversion rate, highlights the three onboarding steps with highest abandonment, shows conversion trends by traffic source (organic traffic versus paid), and flags prospects who abandoned mid-process for follow-up.
Formulas & Financial Impact Examples
Basic formulas for CRO measurement in financial services:
- Conversion Rate = (Conversions ÷ Qualified Visitors) × 100
- Uplift Percentage = ((New Rate – Old Rate) ÷ Old Rate) × 100
- Incremental AUM = Additional Clients × Average AUM per Client
- Payback Period = CRO Investment ÷ Monthly Revenue from Incremental Clients
Worked example: A bank improves KYC completion from 60% to 70% on 10,000 leads in 2026.
- Previous completions: 10,000 × 60% = 6,000 clients
- New completions: 10,000 × 70% = 7,000 clients
- Incremental clients: 1,000
- If average AUM per client is CHF 500,000 and annual management fee is 1%, incremental annual revenue = 1,000 × CHF 500,000 × 1% = CHF 5,000,000
This demonstrates how minor conversion lifts in high-value segments can justify an InvestGlass deployment for institutions of any size. The cro strategy becomes self-funding through improved conversion economics.
Common CRO Mistakes in Financial Services & How InvestGlass Avoids Them
Regulated institutions face unique challenges when implementing CRO. Copying generic e-commerce tactics often backfires, and failing to involve compliance teams creates regulatory risk. InvestGlass is built specifically for regulated industries, helping avoid common pitfalls through purpose-built templates, workflows, and approval processes.
Common CRO mistakes in financial services:
- Copying e-commerce conversion tactics without adapting for compliance requirements
- Ignoring legal review for landing pages and form language
- Overcomplicating onboarding flows with unnecessary data requests
- Not involving relationship managers who understand client objections
- Testing without sufficient sample sizes or statistical rigor
- Failing to document test results for audit purposes
Ignoring Compliance & Legal Review
Running cro efforts without legal sign-off creates regulatory risk. A landing page that oversimplifies risk disclosures or a form that omits required regulatory language can result in compliance violations, client complaints, or regulatory sanctions.
InvestGlass addresses this challenge by enabling pre-approval of templates, messages, and workflows by compliance teams. All versions are logged with timestamps and approvals, creating audit trails that demonstrate governance.
Realistic scenario: A bank wants to test a “simplified” risk disclaimer to improve conversions on an investment product page. The marketing team creates two variants. InvestGlass workflow routes both to compliance for review before testing begins. Compliance approves both variants as meeting FINMA and ESMA standards, and the test proceeds with full documentation.
Overcomplicated Journeys & Data Overload
Asking for too much data at once reduces onboarding completion, even when regulation does not require all information immediately. Prospects abandon forms that feel intrusive or endless.
InvestGlass enables institutions to split data capture across stages while staying compliant:
- Prospect stage: Basic contact information and investment interest
- Client stage: Full KYC, tax residency, and suitability assessment
- Enhanced due diligence: Additional documentation for high-risk clients or large investments
Example: A private bank removed non-essential marketing questions from the first onboarding step. Fields like “How did you hear about us?” were moved to a post-completion survey. This single change increased first-step completion by 14% without affecting KYC quality or compliance data integrity.
Not Involving Advisors & Front-Office Teams
Relationship managers often know why clients abandon processes, but their insights rarely feed into cro process plans. They hear objections, answer questions, and understand client hesitations in ways that analytics alone cannot reveal.
InvestGlass centralizes feedback by enabling advisors to tag stalled cases with reasons. An advisor can note “confusing tax residency step” or “client wanted to discuss fees before continuing” directly in the CRM. These tags aggregate into optimization backlogs that product and digital teams can address.
2025-2026 example: A regional bank noticed high abandonment at the suitability questionnaire. Advisors reported that prospects frequently called with questions about risk category definitions. The digital team created a short explainer video embedded in the InvestGlass form. Abandonment at that step dropped by 22%, and advisors received fewer interruption calls.
How to Get Started with CRO Using InvestGlass
Implementing CRO does not require a multi-year transformation program. Launching a CRO program a structured, strategic approach to conversion rate optimization helps guide and organize your efforts from the outset. A structured 90-day roadmap can deliver measurable results for banks and wealth managers adopting InvestGlass as their CRM and optimization backbone.
Getting started steps:
- Audit existing digital journeys (website, onboarding, client portal) to identify current conversion rates
- Configure InvestGlass workflows to track conversion events at each step
- Define conversion goals aligned with business objectives (new clients, AUM, meeting bookings)
- Prioritize high-impact bottlenecks for initial testing
- Design and deploy first A/B tests with compliance approval
- Review results and document learnings
- Scale winning variants across relevant markets and segments
Swiss hosting, on-premise options, and complete data sovereignty are available from day one with InvestGlass. This differentiates the platform from global CRM competitors that may store data in jurisdictions with less favorable privacy frameworks.
Sample 90-Day CRO Plan with InvestGlass
Days 1-30: Foundation
- Connect existing website and onboarding flows to InvestGlass
- Define conversion events for each critical action (account opening, KYC completion, meeting booked)
- Build first dashboards for onboarding and KYC conversion tracking
- Establish baseline metrics for current performance
- Identify quick wins from obvious friction points
Days 31-60: Testing
- Identify top two bottlenecks (e.g., identity verification step and suitability questionnaire)
- Formulate hypotheses with expected outcomes
- Design A/B tests inside InvestGlass workflows with compliance approval
- Deploy tests to appropriate traffic segments
- Monitor progress and gather user feedback through advisors
Days 61-90: Optimization
- Run tests to statistical significance
- Gather data and involve relationship managers in interpreting results
- Document findings with full audit trails
- Deploy winning variants across relevant markets
- Plan next quarter’s optimization priorities
Realistic 2026 scenario: A regional asset manager with CHF 3 billion AUM implements this 90-day plan using InvestGlass. By day 90, they have improved improve conversions on their digital onboarding from 28% to 36% and reduced time-to-onboard from 9 days to 5 days. The increase conversions translate to an additional 45 new clients in Q2, representing approximately CHF 180 million in net new assets.

Conclusion: Building a CRO Culture with InvestGlass
In 2026, sustainable growth in financial services comes from optimizing existing website traffic and client journeys, not just buying more visitors to convert. The institutions that invest in conversion optimization outperform competitors who focus solely on acquisition spend.
InvestGlass combines Swiss data sovereignty, CRM, digital onboarding, AI personalization, marketing automation, and client portals to support continuous optimization in regulated environments. The platform enables financial institutions to run compliant experiments, document results for audit purposes, and scale winning approaches across markets and segments.
CRO is not a one-time project but a long-term discipline. Institutions that embed the research-hypothesis-test-learn-scale loop into their operations continuously improve their site’s conversion rate, reduce cost per acquisition, and strengthen client relationships. InvestGlass serves as the central platform coordinating marketing, compliance, advisory teams, and search engine optimization efforts into a unified optimization engine.
Next steps with InvestGlass:
- Book a demo to review your current conversion funnels and identify quick-win opportunities
- Work with InvestGlass specialists to define a 12-month CRO roadmap aligned with your business objectives
- Deploy your first A/B test on onboarding or client portal within 30 days of implementation
The difference between a 5% and 10% conversion rate may seem small in percentage terms, but for regulated institutions managing substantial AUM, that gap represents millions in recurring revenue and hundreds of client relationships. InvestGlass provides the infrastructure to close that gap while maintaining the compliance, security, and data sovereignty that regulated financial services demand.
Landing Page Optimization for Regulated Financial Services
Landing page optimization is a cornerstone of successful conversion rate optimization for regulated financial services. Unlike generic web pages, landing pages in banking, wealth management, and insurance must balance regulatory disclosures with persuasive design to guide website visitors toward a desired action whether that’s starting digital onboarding, requesting a portfolio review, or submitting a KYC form.
Understanding user behavior is the first step in the conversion rate optimization process. By analyzing how visitors interact with your landing page where they click, how far they scroll, and at what point they abandon the process you can identify friction points that hinder conversions. Tools like InvestGlass’s integrated analytics provide granular insights into user interactions, allowing you to pinpoint exactly where users drop off and why.
User feedback is equally valuable. Gathering qualitative input through post-visit surveys, feedback widgets, or direct outreach by relationship managers helps uncover pain points that quantitative data alone might miss. For example, if multiple users mention that a regulatory disclaimer is confusing or a call to action is unclear, this feedback can inform targeted improvements.
To boost conversions and improve your site’s conversion rate, focus on these landing page optimization strategies:
- Clear, single-minded value proposition: Communicate the benefit of taking the desired action in the first screen, tailored to your target audience and compliant with regulatory requirements.
- Prominent, trust-building elements: Display security badges, regulatory credentials, and Swiss data sovereignty statements to reassure privacy-conscious visitors.
- Streamlined forms: Minimize the number of fields required for initial conversion, asking only for essential information to reduce user drop-off.
- Compelling call to action: Use action-oriented language that makes the next step obvious and low-friction, such as “Start Secure Onboarding” or “Request a Confidential Consultation.”
- Responsive, fast-loading design: Ensure the landing page performs flawlessly on both desktop and mobile devices, as slow loading pages can cause users to abandon the process.
- Continuous optimization: Regularly test different headlines, images, and form layouts using split testing to determine which variants drive the highest conversion rate among your website visitors.
A practical example: A Swiss wealth manager using InvestGlass noticed that many visitors abandoned the onboarding landing page at the regulatory disclosure section. By simplifying the language, adding a progress indicator, and placing a security badge next to the call to action, the conversion rate increased by 19% over two months. This data-driven, user-centric approach to landing page optimization demonstrates how understanding user behavior and acting on user feedback can significantly boost conversions in regulated financial services.
By making landing page optimization a core part of your conversion rate optimization process, you ensure that every visitor to your site is more likely to take the desired action turning existing website traffic into qualified, compliant clients.

